
Executive summary
Analytics earns its keep when it changes a decision. This guide sets out a practical analytics workflow for commercial roles — Excel for modelling, AI tools for rapid exploration and pattern recognition, and disciplined KPI design — plus the data-cleaning habits that determine whether any of it gets used.
Key takeaways
- Start from the decision, then work backwards to the metric and the data.
- Excel is still the fastest place to build and defend a commercial model.
- AI tools accelerate exploration and pattern recognition, but the analyst owns the framing.
- Every dashboard tile needs an owner and an implied action.
- Data cleaning is where most analytical credibility is won or lost.
Key highlights
- — A decision-first analytics workflow in five steps
- — Excel + AI: a practical stack for commercial modelling
- — A KPI quality test to remove vanity metrics
Work backwards from the decision
Before opening any tool, write the decision in a sentence: which beats to add, which SKUs to delist, which outlets to prioritise. Then name the metric that would settle it, then the data required to compute that metric.
Analysis that begins with available data rather than a pending decision produces interesting charts and no change in behaviour.
- State the decision and its owner.
- Name the deciding metric and its threshold.
- Identify the minimum data needed.
- Build the smallest analysis that answers it.
- Write the recommendation before the visual.
Excel: still the fastest commercial modelling environment
For scenario models, contribution analysis and distributor ROI, Excel remains the quickest path from question to defensible answer. Structure matters: inputs on one sheet, calculations on another, outputs on a third, with no hard-coded numbers buried inside formulas.
Master lookup functions, pivot tables, conditional aggregation and basic sensitivity tables before touching anything more advanced.
AI-assisted analysis: accelerate exploration, keep the judgement
Claude and similar tools are useful for structuring messy data, drafting formulas, summarising long tables and spotting patterns in text fields. They speed up exploration but do not replace the analyst's job of defining the decision, validating assumptions and writing the recommendation.
Use AI for first-pass cleaning, quick sensitivity checks and turning raw notes into structured fields. Then audit every output against the source data before it reaches a stakeholder.
KPI design: a four-part quality test
A KPI is worth tracking if it is actionable by a named owner, sensitive enough to move within the review cycle, resistant to gaming, and unambiguous in definition. Totals such as impressions or visits usually fail at least two of the four.
Important definitions
- KPI
- A key performance indicator: a metric tied to a decision an owner can act on within a defined period.
- Data cleaning
- Standardising, de-duplicating and validating raw records so analysis reflects reality rather than collection artefacts.
- AI-assisted analysis
- Using large language models to accelerate exploration, structure messy data and generate hypotheses while the analyst validates assumptions and owns the recommendation.
My perspective
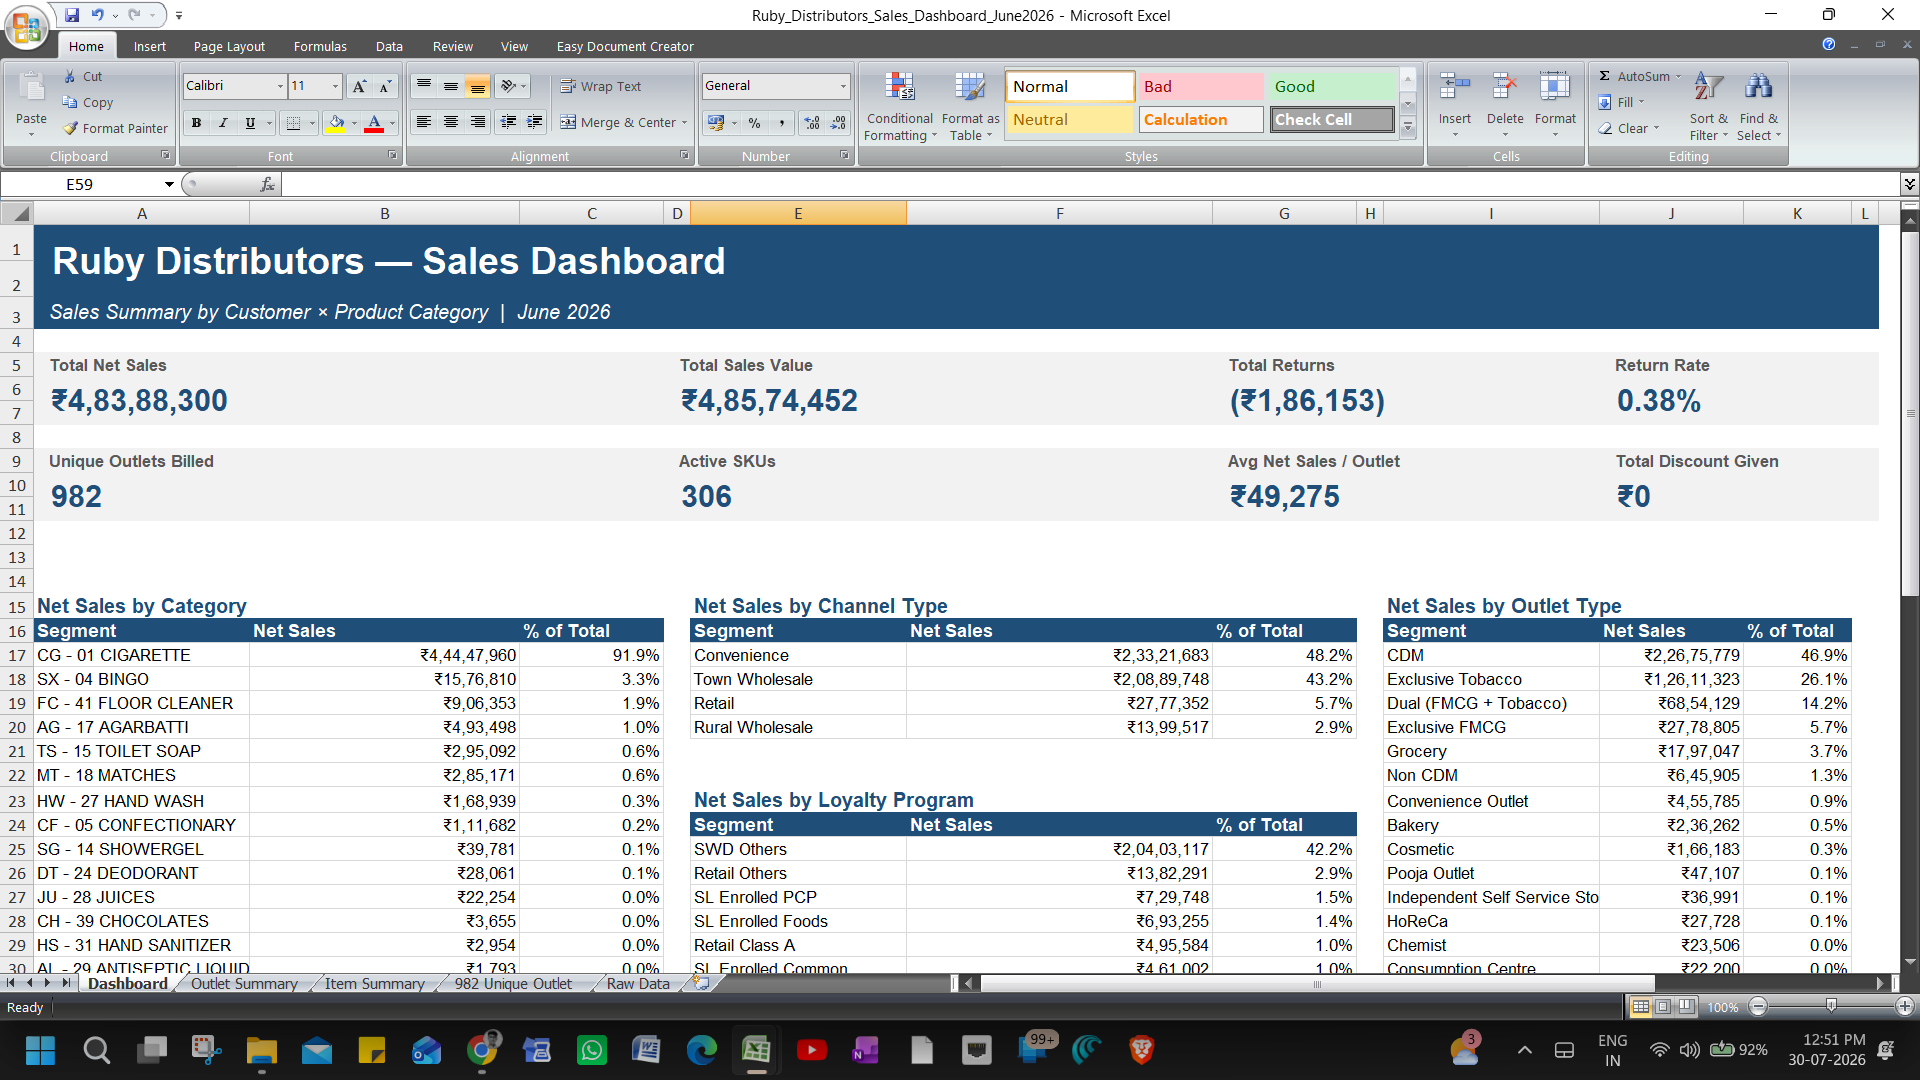
The Ruby Distributors dashboard was built entirely in Excel, with Claude used to structure raw sales data, check formula logic and speed up the first-pass cleaning. The final model, charts and KPIs were mine. That process taught me that AI is best treated as a thinking partner for exploration, not a replacement for judgement — the recommendation still has to come from the analyst.
Conclusion
The toolkit is not the point. Decision-first framing, clean inputs, a defensible Excel model and a dashboard someone actually opens will outperform sophisticated technique applied to an unclear question every time.
Key learnings
- Decisions define metrics; metrics define data — never the reverse.
- Structure spreadsheets so someone else can audit them in five minutes.
- Use AI to accelerate cleaning and exploration; own the final recommendation.
- Collection design deserves as much care as analysis.
Frequently asked questions
- Which analytics tools should an MBA student learn first?
- Excel for modelling and structured thinking, then AI-assisted tools for rapid exploration and pattern recognition. The priority is decision-first framing; the tools serve that, not the other way around.
- How do AI tools fit into a marketing analyst's workflow?
- They accelerate cleaning, summarisation and first-pass insight generation, but the analyst must still own the decision frame, validate assumptions and write the final recommendation.
- What makes a KPI good?
- It is actionable by a named owner, sensitive within the review cycle, hard to game, and defined unambiguously.
- How much time should be spent on data cleaning?
- Commonly half or more of the total effort on any real dataset — and it is where analytical credibility is most often won or lost.
Go deeper
Suggested reading
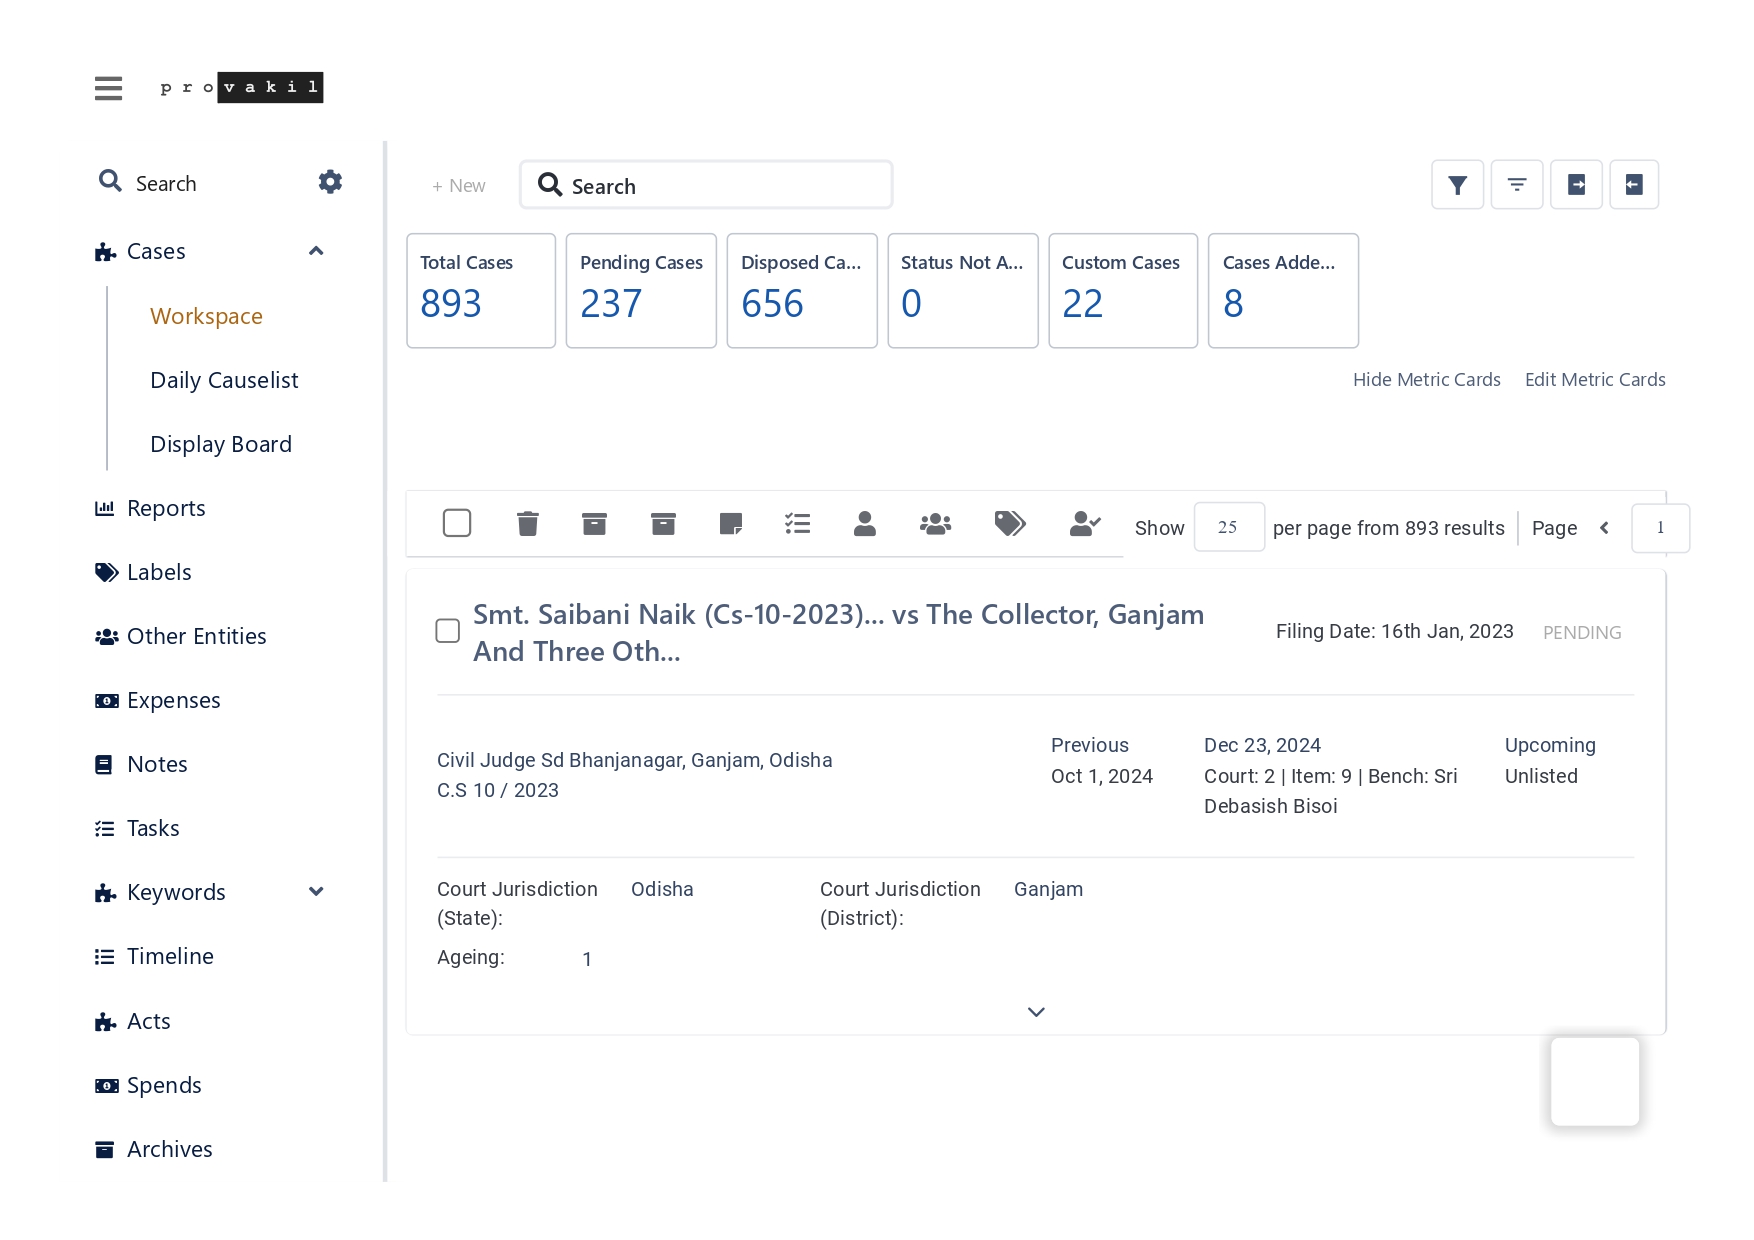
Enterprise Operations Lessons From Indian Oil: Process, MIS and Leadership Reporting
Lessons from a graduate apprenticeship at Indian Oil — a 300+ case litigation portfolio, SAP invoice workflows, MIS reporting and stakeholder discipline.

Product Management Metrics That Matter: From Roadmap to Realised Value
A product management guide to strategy, prioritisation and the metrics — activation, retention, value realisation — that predict product success.

OJEE MBA Preparation Strategy: How I Secured All Odisha Rank 1
An OJEE MBA preparation strategy from the All Odisha Rank 1 holder of 2025 — syllabus mapping, sectional plans and a 16-week study schedule.
Newsletter
New frameworks, field notes and case studies — occasionally, never noise.
Get new Knowledge Hub articles on marketing, business analytics and product management as they are published. Email me to be added to the list.
Subscribe by emailComments
Discussion is not open on this site yet. Thoughts, disagreements or corrections are genuinely welcome — send them directly.